IC Markets Home Sign in Web Trader Contact Us
IC Markets Social IC Markets Social

مركز المعلومات
للمتداولين الجادينs

  • ABOUT US
  • OPEN LIVE ACCOUNT
  • OPEN DEMO ACCOUNT
  • TRADE NOW
  • VISIT OUR BLOG
IC Markets Social
  • ABOUT US
  • OPEN LIVE ACCOUNT
  • OPEN DEMO ACCOUNT
  • TRADE NOW
  • VISIT OUR BLOG
May 14, 2024Australian_Stocks_enIC Markets

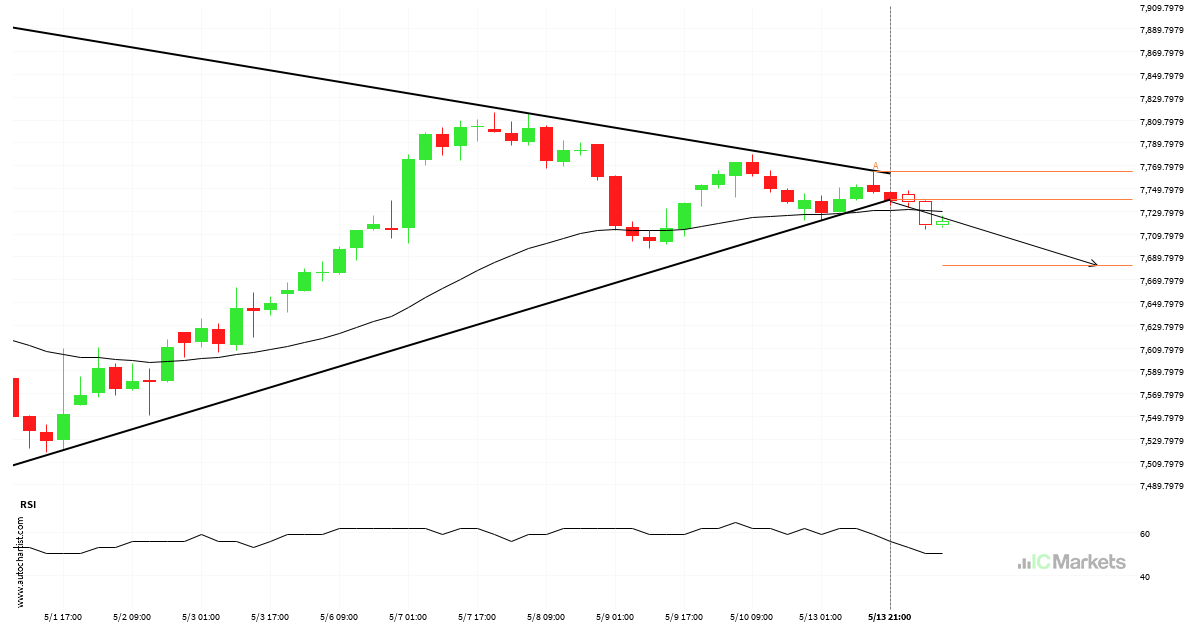
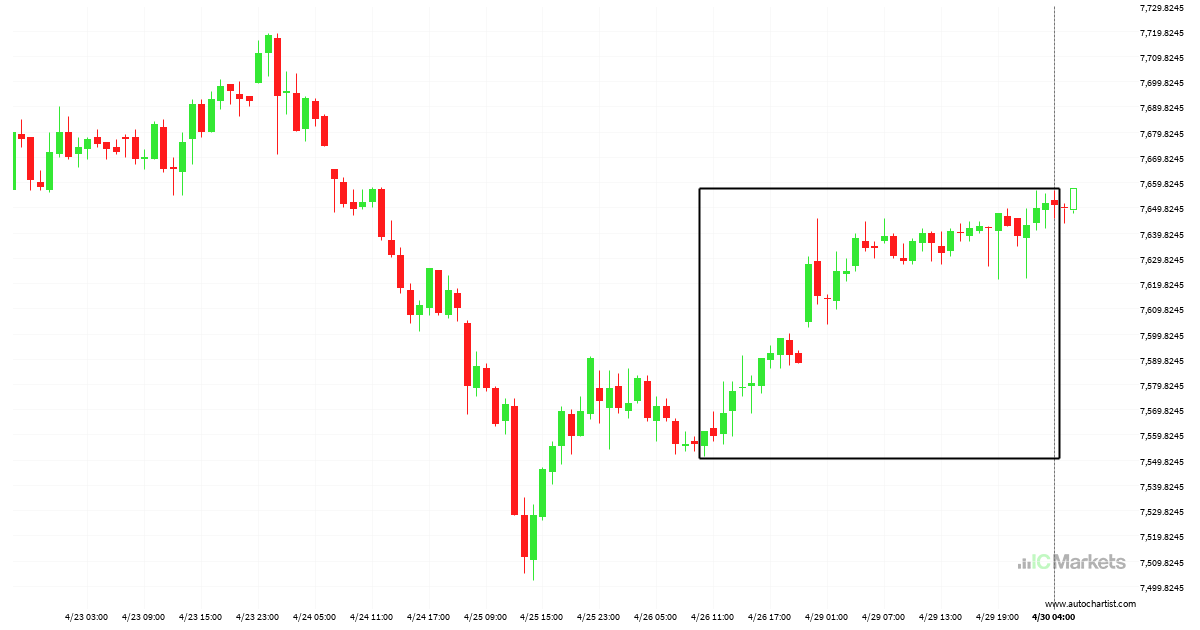
Australia 200 Index – support line breached

This trade setup on Australia 200 Index is formed by a period of consolidation; a period in which the price primarily moves sideways before choosing a new direction for the longer term. Because of the bearish breakout through support, it seems to suggest that we could see the next price move to 7682.2658.

Read more
May 13, 2024Australian_Stocks_enIC Markets

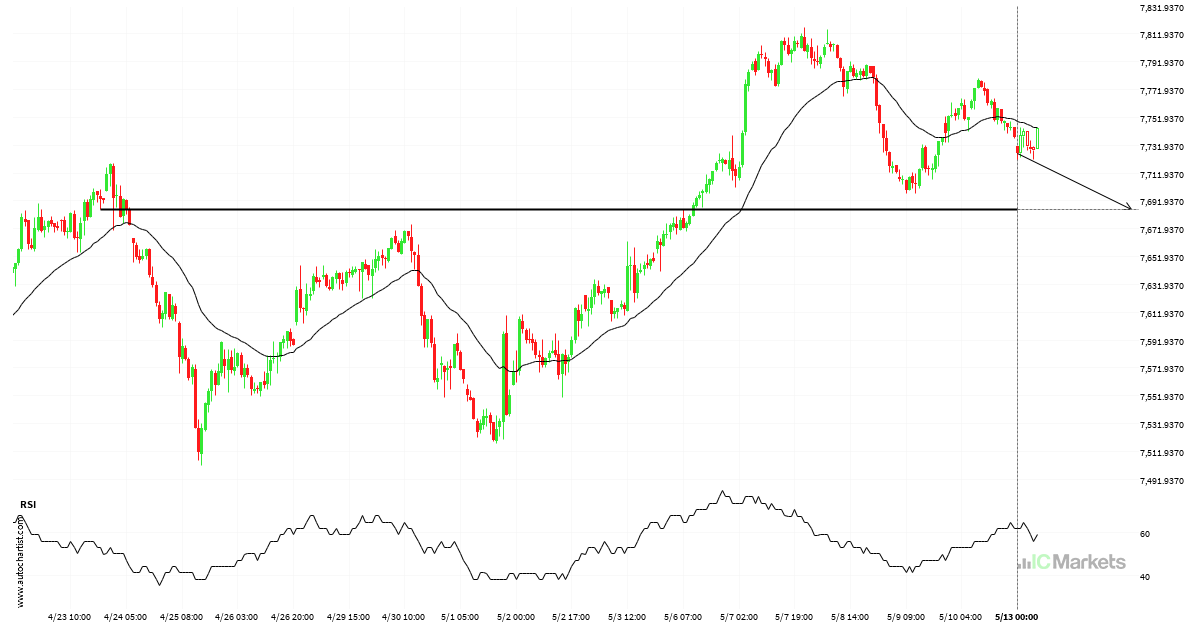
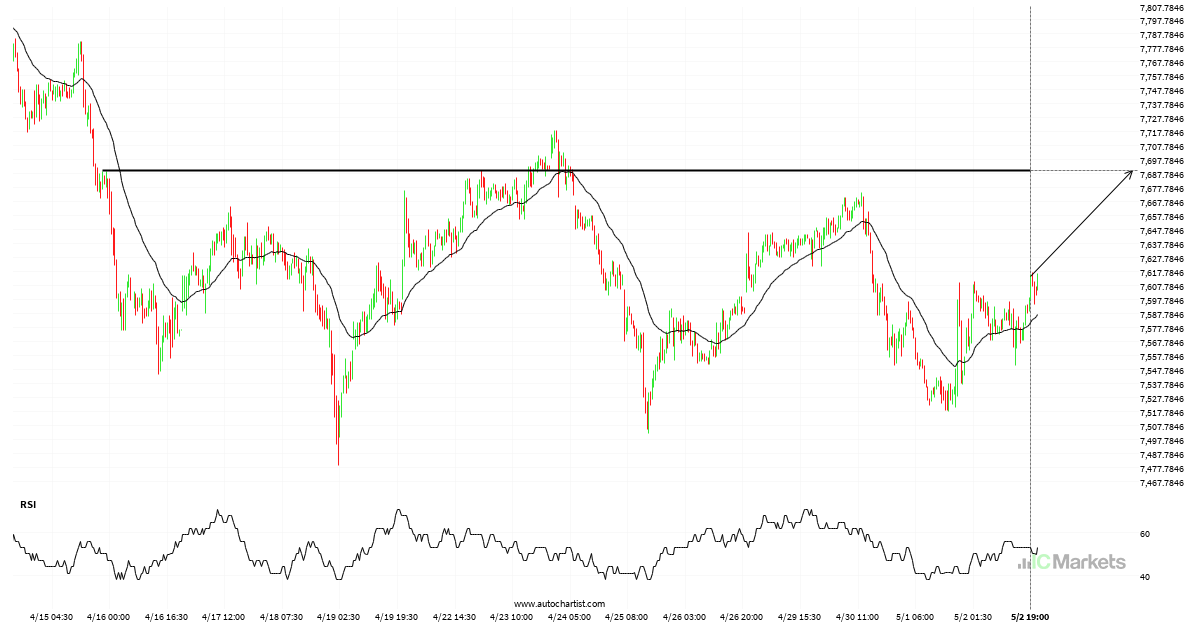
Australia 200 Index approaches important level of 7685.8701

Australia 200 Index is moving towards a key support level at 7685.8701. Australia 200 Index has previously tested this level 3 times and on each occasion it has bounced back off this level. Is this finally the time it will break through?

Read more
May 10, 2024Australian_Stocks_enIC Markets

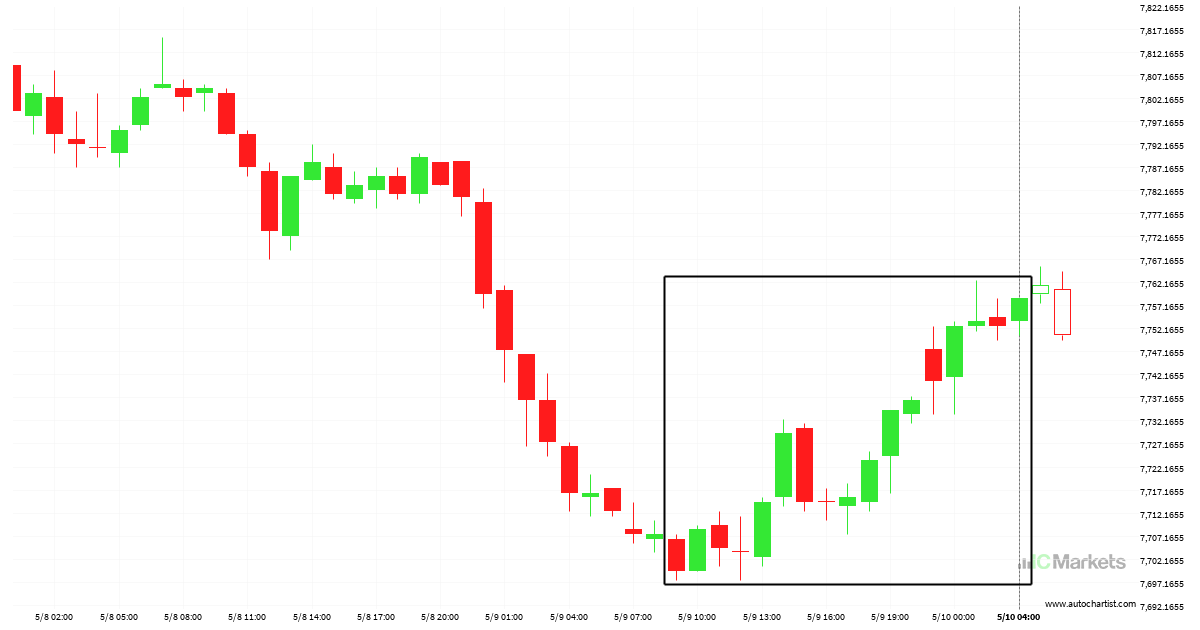
Extreme movement on Australia 200 Index

A movement of 0.77% over 19 hours on Australia 200 Index doesn’t go unnoticed. You may start considering where it’s heading next, a continuation of the current upward trend, or a reversal in the previous direction.

Read more
May 8, 2024Australian_Stocks_enIC Markets

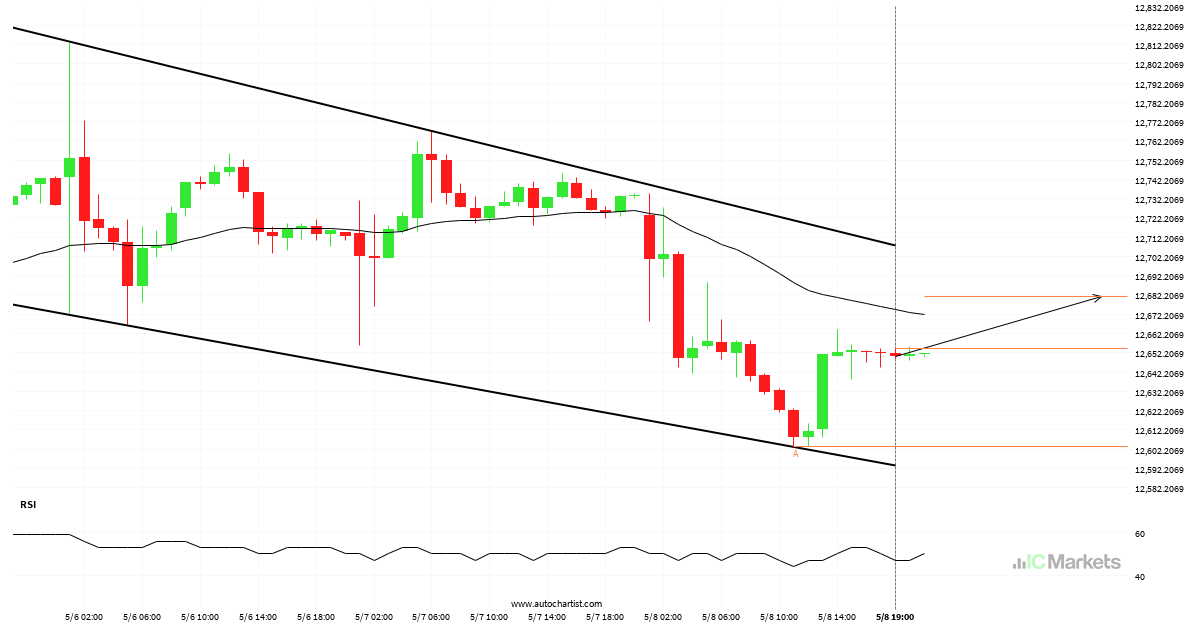
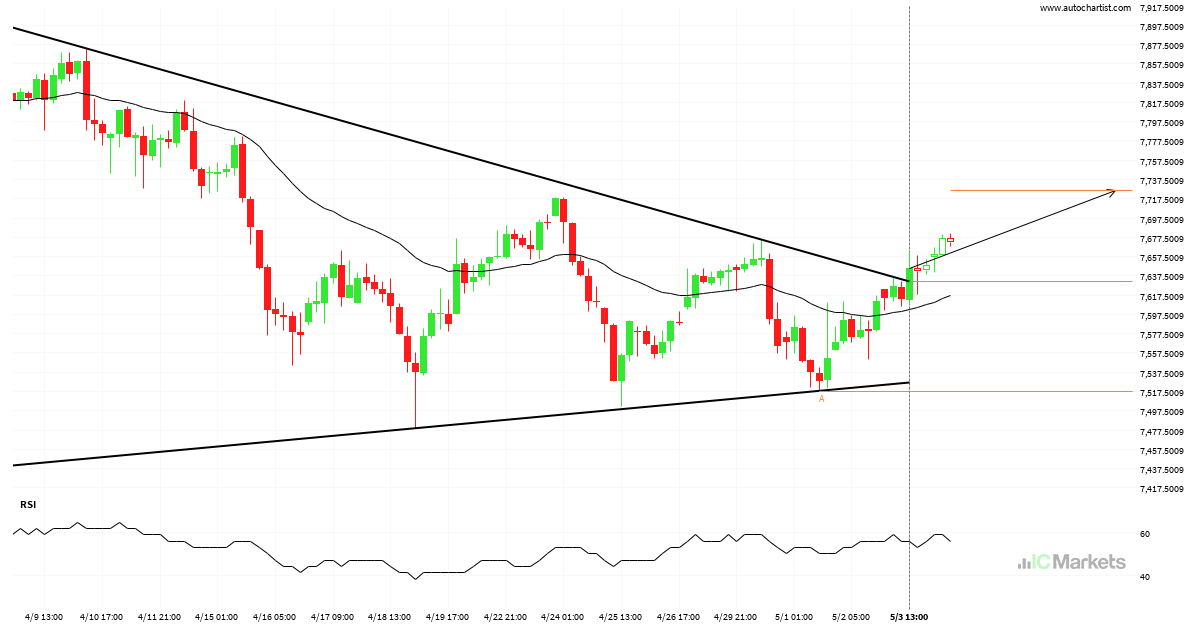
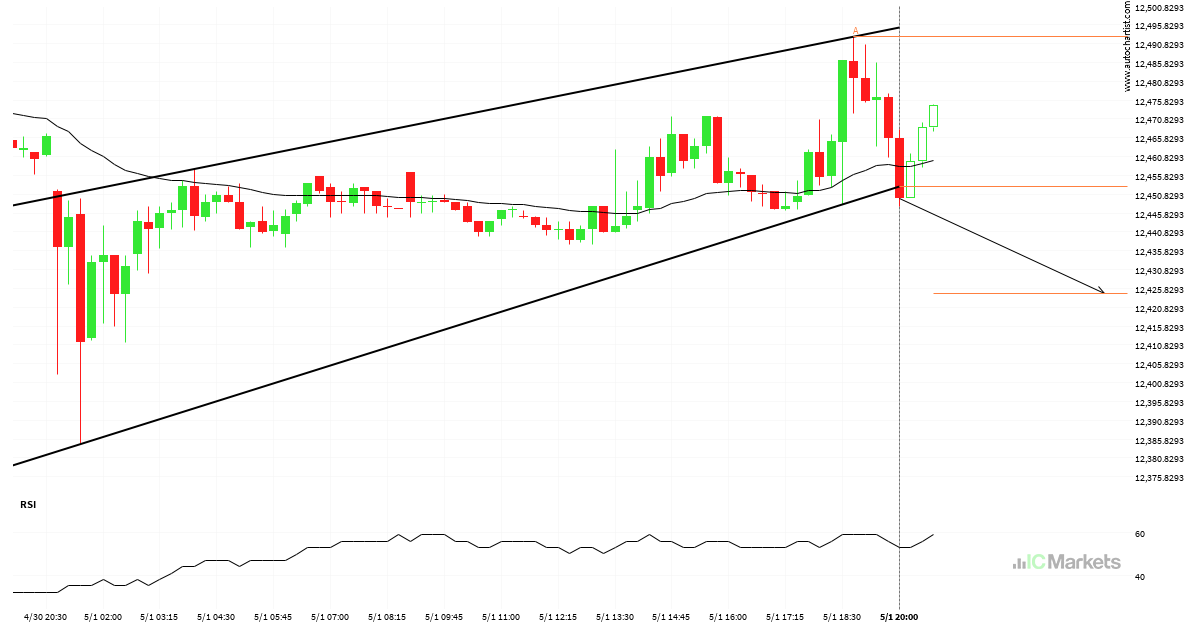
FTSE China A50 Index – Continuation Chart Pattern – Channel Down

FTSE China A50 Index is moving towards a resistance line. Because we have seen it retrace from this line before, we could see either a break through this line, or a rebound back to current levels. It has touched this line numerous times in the last 7 days and may test it again within the […]

Read more
May 7, 2024Australian_Stocks_enIC Markets

Did you miss this move on Australia 200 Index?

Those of you that are trend followers are probably eagerly watching Australia 200 Index to see if its latest 0.86% move continues. If not, the mean-reversion people out there will be delighted with this exceptionally large 4 hours move.

Read more
May 6, 2024Australian_Stocks_enIC Markets

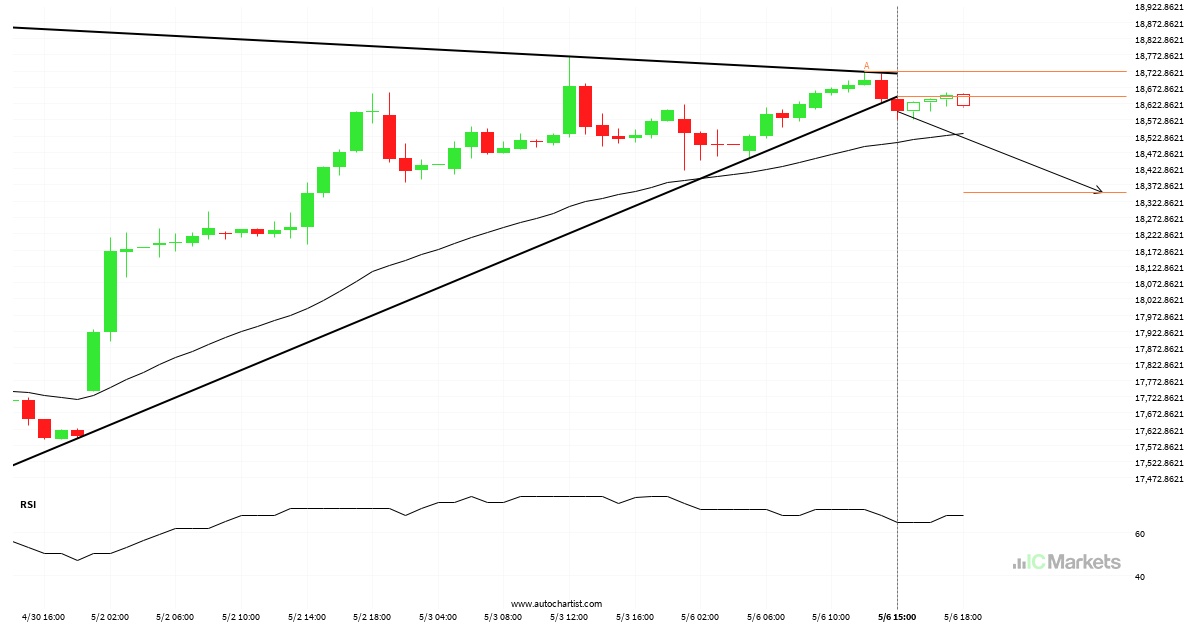
bearish technical pattern on Hong Kong 50 Index 1 hour

The breakout of Hong Kong 50 Index through the support line of a Triangle could be a sign of the road ahead. If this breakout persists, we may see the price of Hong Kong 50 Index testing 18348.8031 within the next 12 hours.

Read more
May 6, 2024Australian_Stocks_enIC Markets

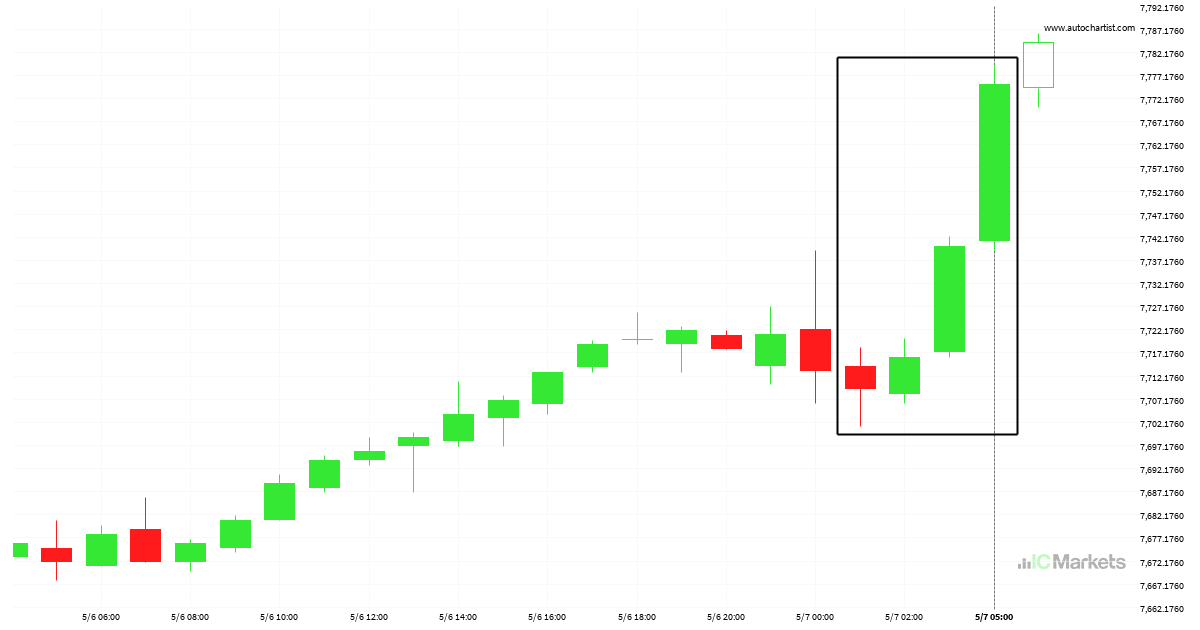
bullish technical pattern on Australia 200 Index 4 hour

Australia 200 Index has broken through a resistance line of a Triangle and suggests a possible movement to 7725.7632 within the next 3 days. It has tested this line in the past, so one should probably wait for a confirmation of this breakout before taking action. If the breakout doesn’t confirm, we could see a […]

Read more
May 2, 2024Australian_Stocks_enIC Markets

Australia 200 Index approaching resistance level

Australia 200 Index is moving towards a key resistance level at 7689.8701. Australia 200 Index has previously tested this level 3 times and on each occasion it has bounced back off this level. Is this finally the time it will break through?

Read more
May 1, 2024Australian_Stocks_enIC Markets

FTSE China A50 Index – support line breached

FTSE China A50 Index has broken through the support line of a Rising Wedge technical chart pattern. Because we have seen it retrace from this line in the past, one should wait for confirmation of the breakout before taking any action. It has touched this line twice in the last 2 days and suggests a […]

Read more
April 30, 2024Australian_Stocks_enIC Markets

Huge bullish move on Australia 200 Index

Australia 200 Index hits 7650.67 after a 1.18% move spanning 4 days.

Read more
  • 1
  • 2
  • 3
  • …
  • 11
  • 12
  • 13
  • 14
  • 15
  • 16
  • 17
  • …
  • 153
  • 154
  • 155

Recent Posts

  • Brent Oil vs US Dollar – نموذج الرسم البياني – قناة صاعدة
  • Brent Oil vs US Dollar – نموذج الرسم البياني – قناة صاعدة
  • Hong Kong 50 Index – نموذج الرسم البياني – مثلث صاعد
  • Hong Kong 50 Index – รูปแบบกราฟ – สามเหลี่ยมขาขึ้น
  • Hong Kong 50 Index – نموذج الرسم البياني – مثلث صاعد

Recent Comments

    Translation


     Edit Translation

    فتح الحساب وتمويله بشكل فوري

    تداول خلال دقائق!

    ابدأ اختبر حساب تجريبي مجاني

    نبذة عن IC Markets Global

    • مركز المساعدة
    • لماذا تختار IC Markets Global؟
    • التنظيم
    • الوثائق القانونية
    • اتصل بنا

    مواصفات التداول

    • الفروقات والعمولات
    • مجموعة المنتجات
    • ساعات التداول
    • التمويل
    • السحب

    تداول الفوركس

    • استعراض الحسابات
    • افتح حساب
    • إطلاق Web Trader


    Forex Trading

    • Accounts Overview
    • Open an Account
    • Launch Web Trader

    Trading Specifications

    • Spreads and Commissions
    • Range of Market
    • Trading Hours
    • Funding
    • Withdrawal

    About IC Markets

    • Chat with a Specialist 24/7
    • Why IC Markets
    • Regulation
    • Legal Documents
    • Contact Us

    IC Markets Global هو الاسم التجاري لشركة Raw Trading Ltd، التي تخضع لرقابة هيئة الخدمات المالية في سيشل (FSA) برقم ترخيص تاجر الأوراق المالية SD018.

    تحذير من المخاطر: ينطوي تداول الفوركس وعقود الفروقات على مخاطر عالية على رأس المال، لذا يُنصح بالتداول فقط بالأموال التي يمكنك تحمل خسارتها. قد لا يكون تداول الفوركس وعقود الفروقات مناسبًا لجميع المستثمرين، لذا يُرجى التأكد من فهمك التام للمخاطر المُحتملة، وطلب استشارة مستقلة عند الحاجة. يُرجى قراءة بيان إفصاح المخاطر والتأكد من فهمك التام له.

    الدول المحظورة : لا تقدم شركة Raw Trading Ltd خدماتها لسكان دول معينة مثل الولايات المتحدة الأمريكية وكندا والبرازيل وإسرائيل ونيوزيلندا وإيران وكوريا الشمالية (جمهورية كوريا الشعبية الديمقراطية) أو دولة يكون فيها مثل هذا التوزيع أو الاستخدام مخالفًا للقانون أو اللوائح المحلية.

    يجب أن تكون قد بلغت الثامنة عشرة من عمرك، أو السن القانوني المحدد في بلدك. بتسجيلك حسابًا لدى شركة رو تريدينج المحدودة، فإنك تُقر بأنك تُسجل بمحض إرادتك، دون أي تحريض من جانب Raw Trading Ltd .

    لا تُوجِّه Raw Trading Ltd موقعها الإلكتروني وخدماتها لأي فرد في أي دولة يُحظر فيها استخدام موقعها وخدماتها بموجب القوانين أو اللوائح المحلية. عند الوصول إلى هذا الموقع من دولة قد يُحظر فيها استخدامه، تقع على عاتق المستخدم مسؤولية ضمان توافق أي استخدام للموقع أو الخدمات مع القوانين أو اللوائح المحلية. لا تُقرّ شركة Raw Trading Ltd بأن المعلومات المتوفرة على موقعها الإلكتروني مناسبة أو صالحة للاستخدام في جميع الولايات القضائية.

    الوثائق القانونية

    © 2022 Raw Trading Ltd | All rights reserved.
    • Sample Page